HOW TO
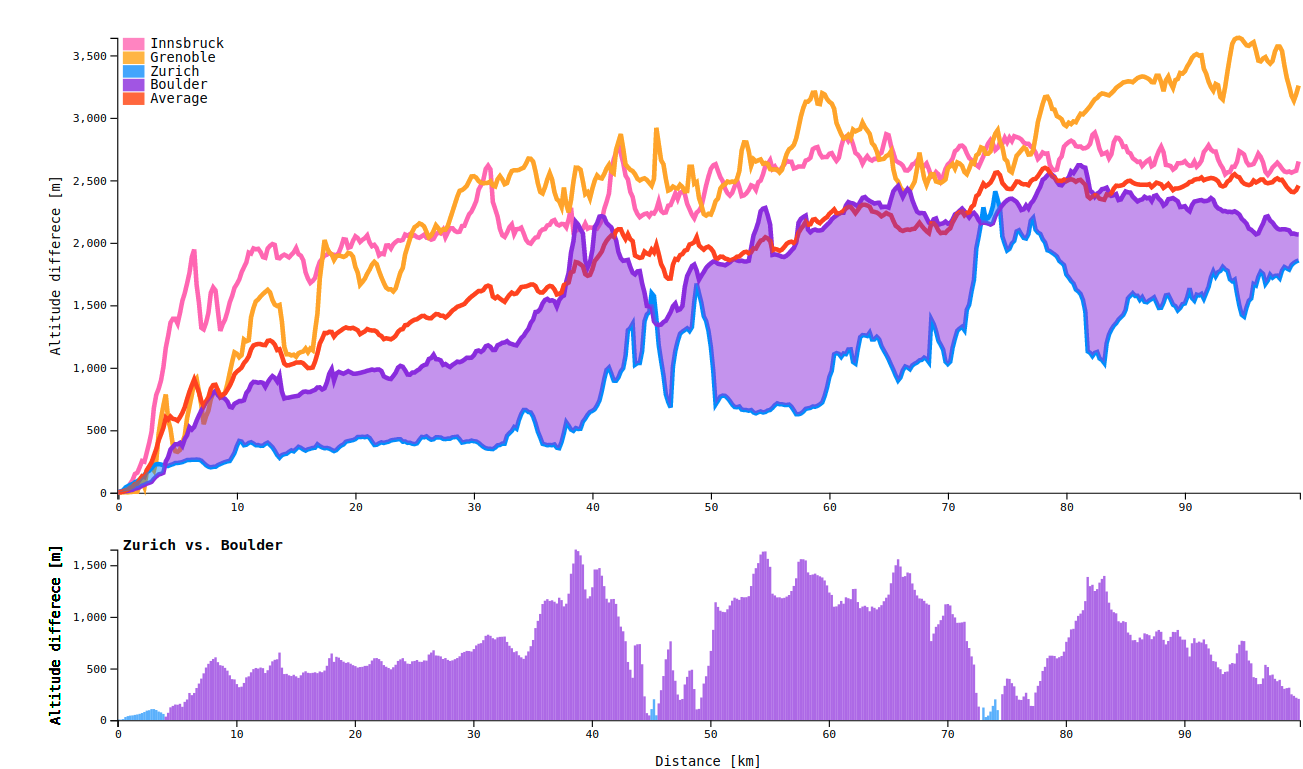
This plot shows the maximum altitude around some university in an alpine enviroment.
The value shown on the y axis is the altitude difference between the university and the highest ground
around the university at the given distances
- Click on any line or any legend item to display the altitude difference between the clicked
university and the average altitude at each give distance.
- Click again on a different university to display the altitude difference between that university and
the last clicked one